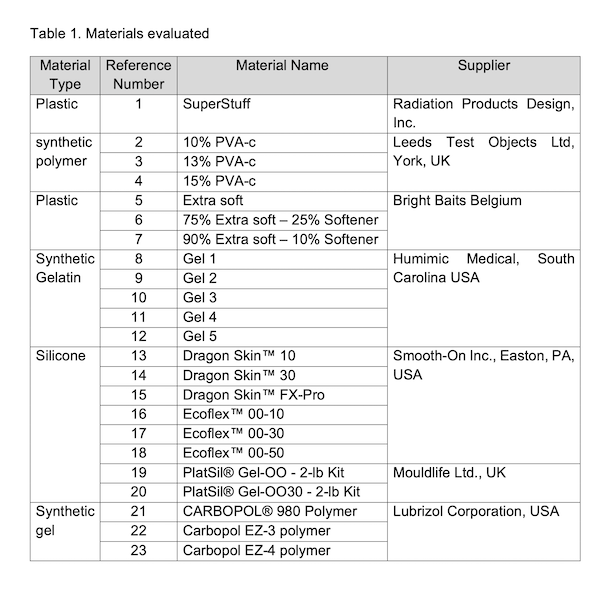
Samples of the materials listed in Table 1 were produced according to the manufacturer's instructions and placed in a test tube. To measure stability over time, the CT number and T1 and T2 relaxation times of the samples have been measured monthly over 7 months. CT scans were acquired using Philips Brilliance BigBore (Philips Medical Systems, Best, Netherlands) with the following settings: 120 kVp, 104 mAs, 2 mm slice thickness, and in-plane resolution of 1.17 mm.
MRI relaxation times were measured using a 3T Siemens Prisma MRI scanner (Siemens Healthineers, Erlangen, Germany). Inversion recovery and Spin-Echo-Multi-Contrast sequences were used to create T1 and T2 maps, respectively. On CT images, T1 and T2 maps, volumes within the materials were drawn, and the mean and standard deviation were measured within these volumes.
To measure stability after radiation exposure, other samples of the same materials were exposed to radiation using an Elekta Versa HD linear accelerator, delivering 10, 100, 250, 500, and 1000 Gy. CT number and MRI relaxation times after radiation exposure were measured.
