Fluctuation in dose measurement resulting from small spot size and spot positional uncertainty
MO-0670
Abstract
Fluctuation in dose measurement resulting from small spot size and spot positional uncertainty
Authors: Hong Qi Tan1, Zubin Master1, Kah Seng Lew1, Calvin Wei Yang Koh1, Andrew Wibawa1, James Cheow Lei Lee1, Sung Yong Park1
1National Cancer Centre Singapore, Radiation Oncology, Singapore, Singapore
Show Affiliations
Hide Affiliations
Purpose or Objective
Contrary to X-ray and passive scattering proton beam, monitor unit in a proton pencil beam scanning (PBS) system needs to be calibrated in terms of the number of protons in each mono-energetic pencil beam. This is equivalent to measuring the dose-area-product (DAP) to water which can be achieved through two methods using reciprocity principle: 1) a point chamber in large, scanned field or 2) a large Bragg peak chamber in a single pencil beam. In this study, we will show the difficulty of achieving a reproducible DAP measurement with the first method for a high energy proton beam with small spot.
Material and Methods
The lowest (70.2) and highest energy (228.7) proton beam from the Hitachi PROBEAT machine were used in this study. A 10x10 cm2 scanned field with a 2.5 mm spot spacing was used for DAP measurement, as was required by the TPS. The flatness of the fields (defined in accordance with IEC 60976) was assessed using the PTW Octavius 1500, and the dose was measured using an advanced Markus chamber placed at a water equivalent depth of 2 cm. A simulation of the dose scored in the detector with 5 mm sensitive volume was also developed to understand the relationship between spot sizes, dose fluctuation and spot positional uncertainty. The spot positional uncertainty was estimated from the log file extracted from the actual irradiation.
Results
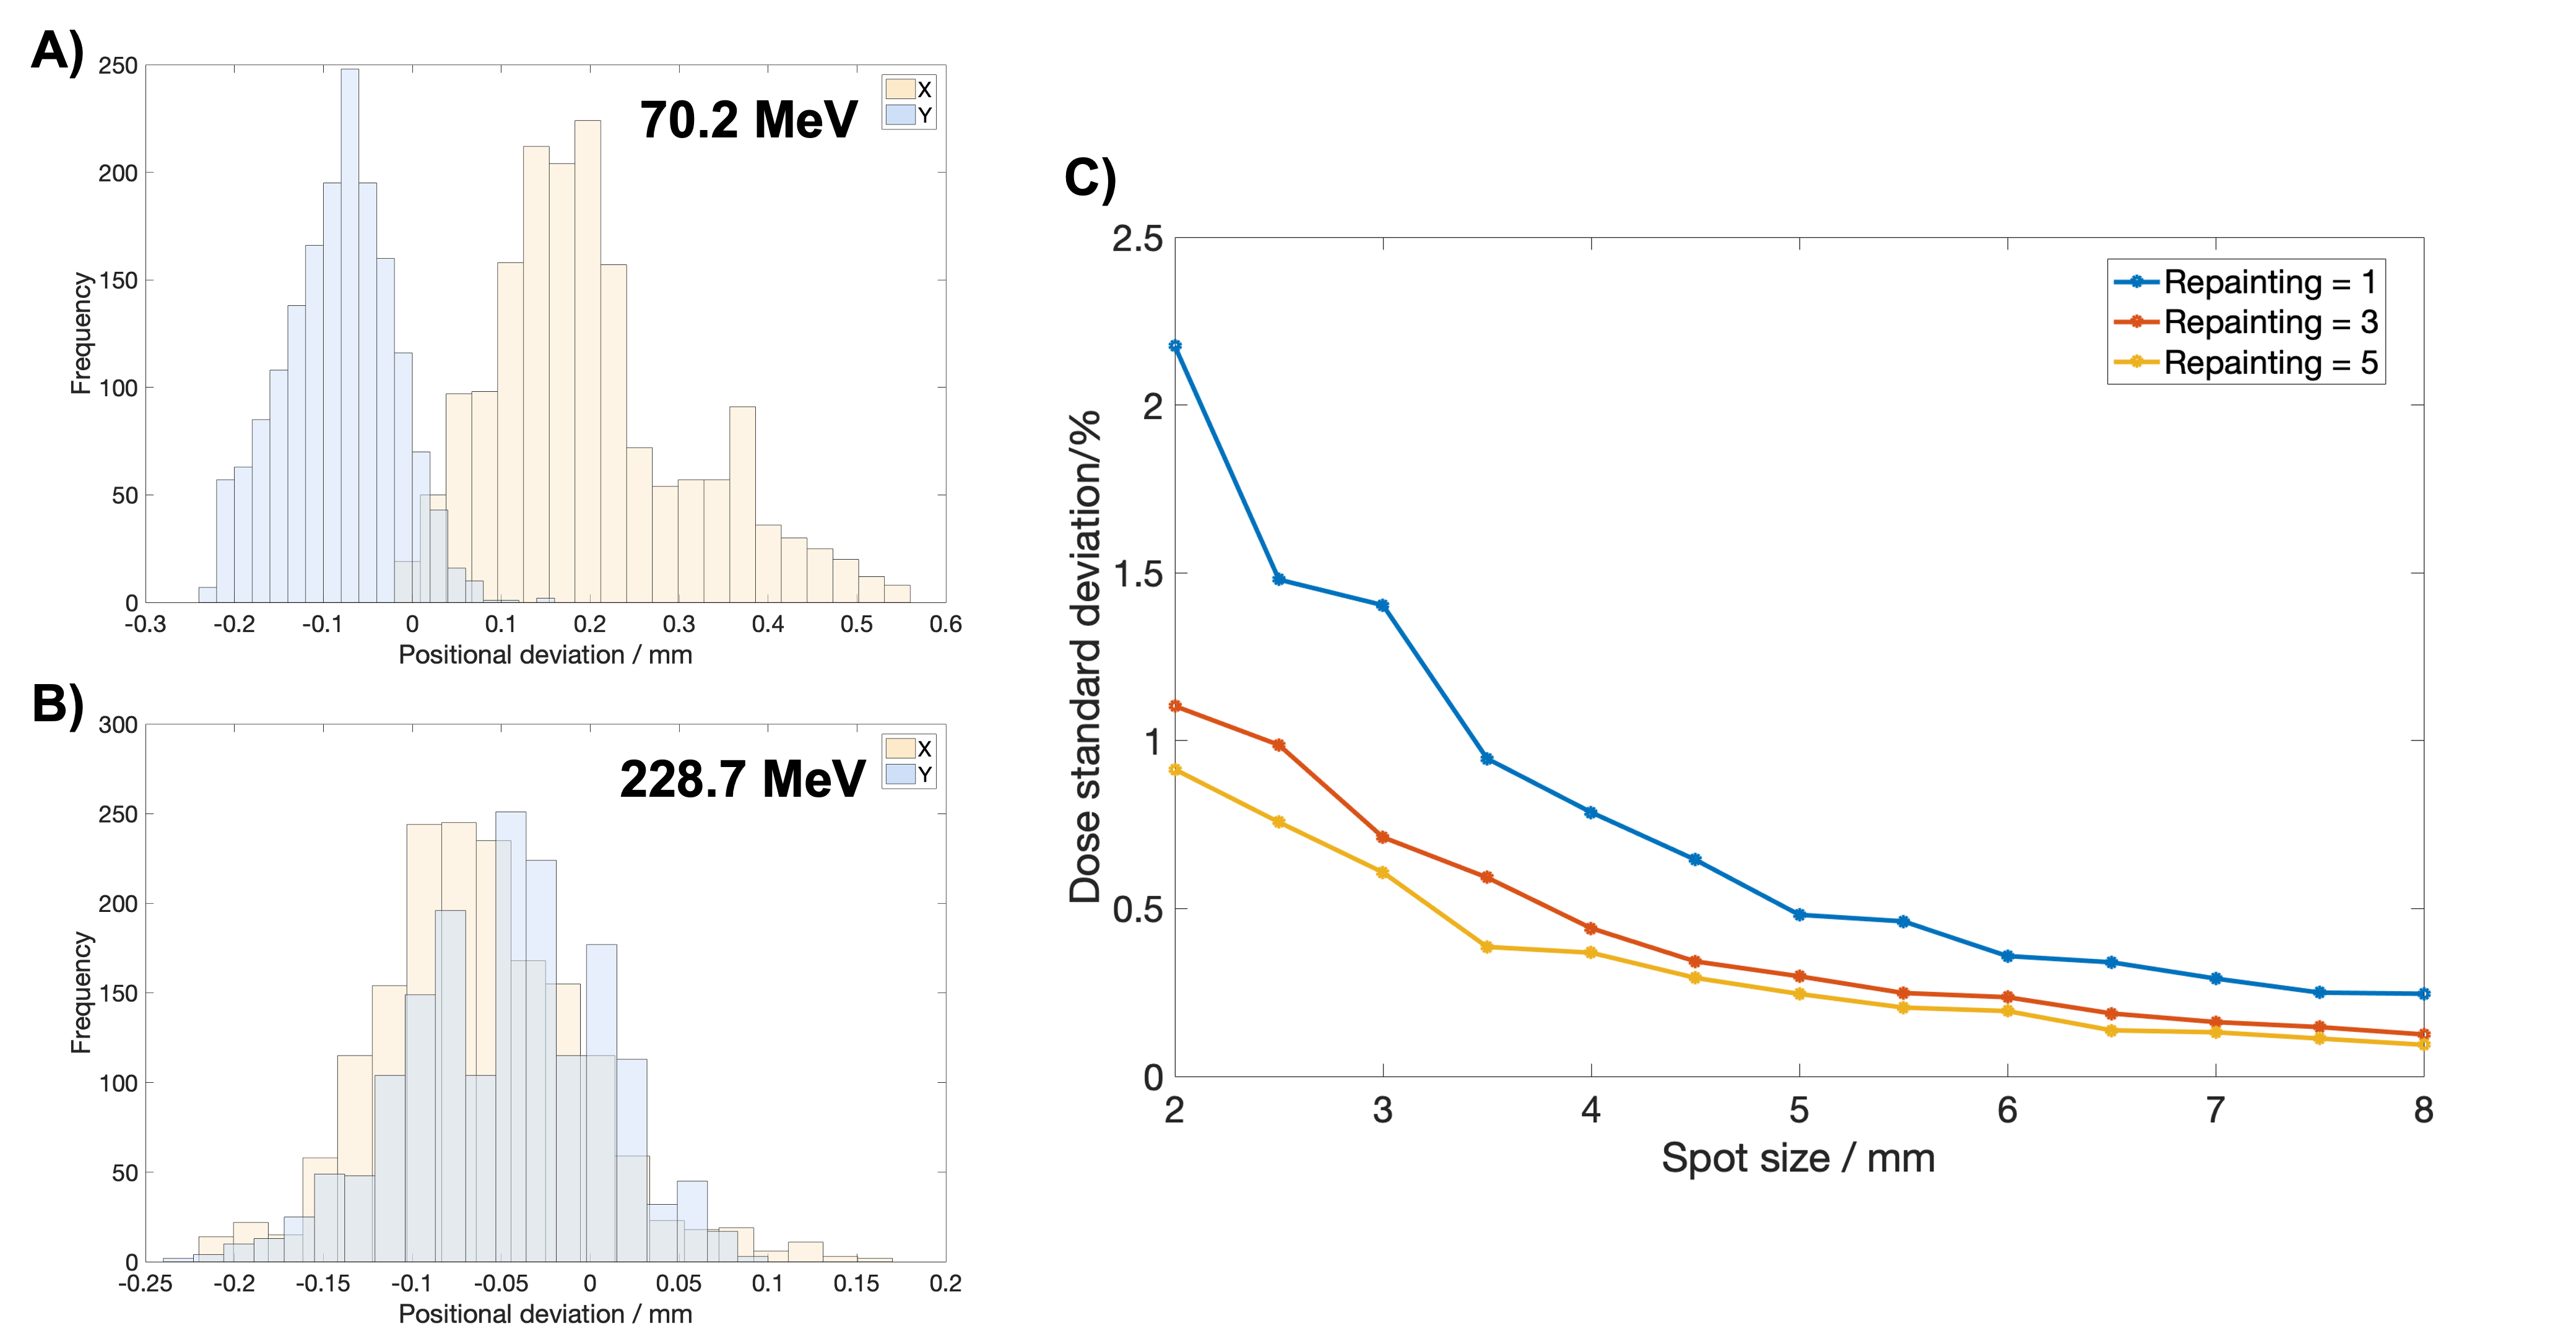
Table 1 shows the measurement results. A large fluctuation with SD 0.98% can be observed with the highest energy with no repainting. Unsurprisingly, repainting reduces the SD of the charge measurement but introduced a systematic drift in the charge collection readings. Using the spot positional deviations recorded in the log file, we estimated the spot position uncertainty to be about 0.1 mm and this value is input into the simulation of the dose fluctuation in the chamber. The result is shown in Figure 1.
| Repainting | 1-sigma semi-minor/semi-major Spot Size at 2cm depth (mm)
| Flatness (%)
| Charge collected (nC)
| Charge collected standard deviation (%)
|
| 70.2 MeV | 1 | 5.67 / 5.91
| 0.277
| 1.145 (1.143 to 1.149)
| 0.22
|
| 228.7 MeV | 1 | 1.97 / 2.11
| 1.16
| 0.8858 (0.877 to 0.897)
| 0.98
|
228.7 MeV
| 2 | 1.97 / 2.11
| 0.630
| 0.8914 (0.8875 to 0.898)
| 0.66
|
228.7 MeV
| 3 | 1.97 / 2.11
| 0.599
| 0.8933 (0.889 to 0.8955)
| 0.27
|
Table 1: A summary of the spot sizes, flatness and advanced Markus chamber measurements for the lowest and highest energies.

Figure 1: (A) and (B) shows the histogram for the spot positional deviations for 70.2 and 228.7 MeV respectively for the X and Y directions. Using a spot position uncertainty of 0.1 mm (1-sigma), a simulation was done to determine the dose uncertainty in the Markus chamber’s sensitive volume for different spot sizes and numbers of repainting.
Conclusion
Small spot size increase the sensitivity of the dose measurement with small chamber. Repainting can decrease this fluctuation, but a systematic drift is observed with our measurement. MU calibration with a large BPC using the second method could potentially avoid the measurement fluctuation problem encountered in this study.